All I see is a gray box!
What's being shown?
How do I control which sequences are displayed?
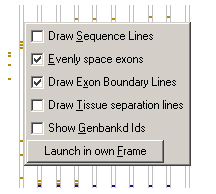
What does the options menu do?
Bugs/Known Issues/To-do
Where is the source code?
E-mail the author
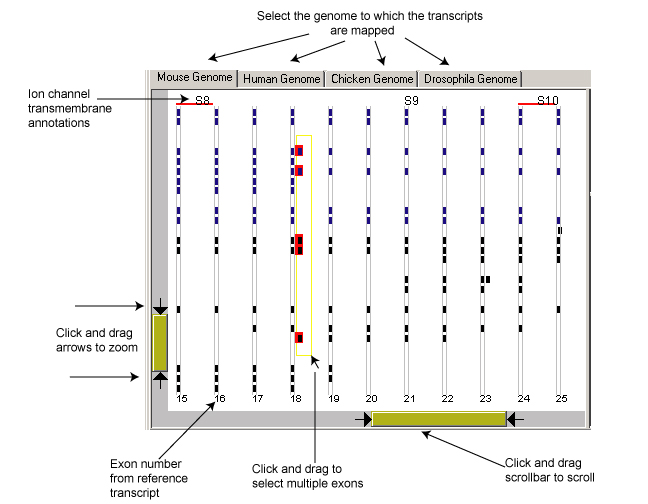
This program displays the exon structure of the alpha subunit of the large-conductance calcium-activated (BK) K+ channel. Each BK channel sequence in mouse, rat, cow, human, chicken, drosophila and C. Elegans unigene clusters were mapped with BLAST to the Mouse, Human, Chicken and Drosophila genomes. Each row in the main viewing area represents a distinct Genbank sequence. Each point in the main viewing area is a region of homology between the Genbank sequence and the genomic sequence. The red lines at the top of the main viewing area represent the known transmembrane domains of the BK channel.
The right panel controls which sequences are displayed and gives information about selected exons and provides a link to Genbank. This screenshot shows the function of each section of the right panel: